


The concept of increasing investment certainty
Reflections on the thought process that will expand your returns

How to get ahead in the investment game
For me, it all comes down to the odds between winning or losing, where the positive return must be X times better versus the possibility of downside measured through the analysis. I will reveal to you the practical work behind the concept in this post. How can you measure and present the possible range of return you wonder? Well, the measure and range of probabilities is a result of a multi-level business analysis presented in one simple metric, that is derived from the financial statements, management interviews, industry research, reasonable expectations, track record, trends, or whatever information is available at the time. This is where you separate yourself from the gamblers by tilting the odds in your favor through hard work performed by using common sense (you don't have to be the brightest kid in the room to do that).
Once you understand, or even better, experience the concept, you will never go back to emotion-driven decision making or following the greater crowd. This is a concept I present to you from a practical perspective, already explained in different forms by various successful investors through the years, from Warren Buffett to Joel Greenblatt. They all may sound complicated and confusing with too much information to handle, but no, it all comes down to the same simple idea, where the odds are in your favor through asymmetrical risk-reward. Some say there would be a margin of safety, some say they are contrarian, or some just call it a cheap stock case. They all mean the same, where you eliminate the casino and become the house that wins most of the time.
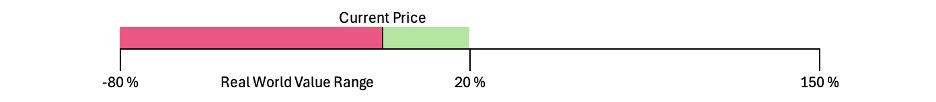
It is insane to set a precise price target on a traded company and even more insane to believe it after an investment banker's pitch. Market prices are constantly moving and in recent years we have seen some increased volatility even in the bigger scale of indices (the actions of Mr. Market). Below is an illustration of what the expected business value, reflected by the price in currency, would look like in different scenarios.

What you are looking at is asymmetrical risk-reward where the odds are in your favor, that is derived from an investment analysis where you ask yourself what would happen in different scenarios, for example after M&A (or anything you can think of), if the business integration bears fruit or if it fails, how it is going to change the future income and balance sheet (which are the derivatives to measure value in this case, reflected by the actual currency). You could even apply this to old-school cigar butt investing, where you ask yourself how much you are going to get of that tangible book value in cash after liquidation. In Buffett's case, he was the catalyst himself. The range can be even wider than -20% to 150% from both tails, but to eliminate the risk and increase the odds, the range should look highly asymmetric, like in the picture above.
The protection where the odds and low level of negative returns can be achieved is, for example, from well-managed balance sheets, shareholder-friendly management, and so on. That is where you really need to do the business analysis and deeply understand what you own.
This kind of thought process can be applied even to bad companies where the business is eroding but the real-world value range is much higher than the price. What you must evaluate is the point where you need to exit, if the value is not realized (this does not mean you are selling at a loss but rather selling when the asymmetry of positive return is eroding because of the business and value yet to be realized). This thought process puts you ahead of the rest, where you truly understand the valuation from the business insights and financial statements.
Sometimes you find companies in overvalued markets with low earnings yield or cooked books, where the odds are reversed; this is also a possible scenario. A great example of this kind of situation is Hindenburg Research, making their returns by shorting the reversed, negative odds.
A practical example
I am going to use the latest research about Logic Instrument as a reference for our practical example, and I suggest you read it following this chapter. Below is an illustration of the multi-level business analysis to begin with, to truly understand what you own and how to measure the real-world value against the current price. It is a scenario where money is being left on the table to pick up.
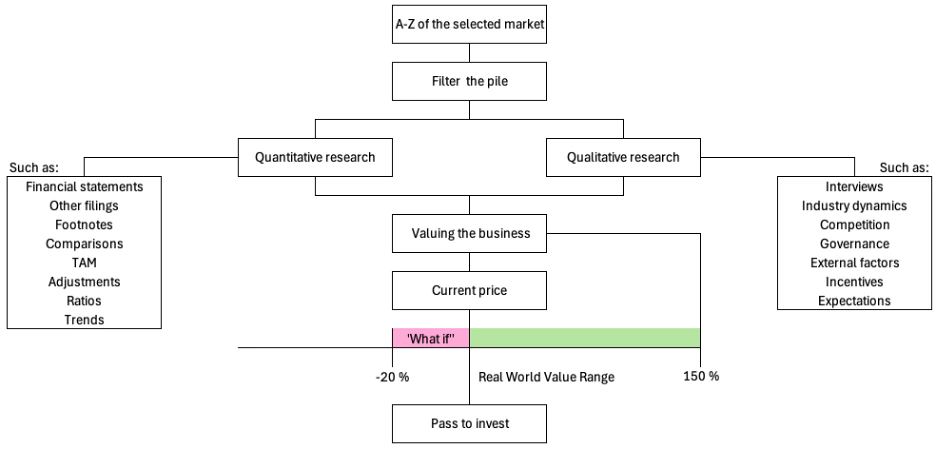
In the case of Logic Instrument, I began with a quantitative analysis where the balance sheet was well managed (with more cash than interest-bearing debt, and with no value priced in the business), providing the first layer of protection against possible setbacks in business, while also selling for low single-digit EV-ratios coupled with double-digit organic and inorganic revenue/income growth. I even estimated the low-price/high-yield achieved on acquisitions that were not particularly disclosed, and I was positively surprised. Why did this opportunity exist? Usually, these kinds of cases are value traps, but this one didn't screen particularly well because of its 8 million euro market-cap in France and temporary COVID-related delays in order books. It became an overlooked company with no investors to bid out the asymmetrical price.
I studied the industry dynamics and realized that qualitatively these products are usually prone to competition, but in this case, it was in a highly niche area, and the industrial customers were differentiated from the regular consumers. Also, there were huge defense-related tailwinds that I learned through a competitor analysis. The execution of growth has been successful, lowering the odds of future failure during the ongoing tailwind. I went on to study the history of the CEO and ownership, with some alarming aspects, but again, realized that the difference in competition he was facing in the other company was not comparable and that his current actions in Logic Instrument were highly valuable for shareholders. He is ambitious, but I take some of his targets with a grain of salt; however, the stock sold for a price where he didn't need to achieve all his targets to provide great returns. I basically created my own luck and the right time to buy (of course the analysis has a lot more to it than what I presented above, just for illustrative purposes).
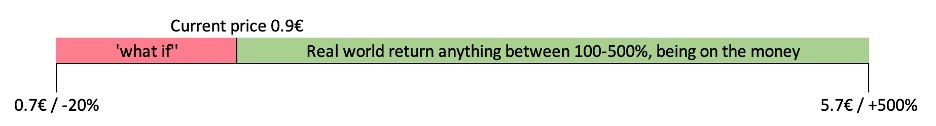
The overlooked company was selling for around 0.9 euro per share when I began to buy, and in the worst-case scenario of failed execution or industry slowdown, it would probably fall close to the historic low-end price-to-sales of 0.4x (that would be a 10 million euro market-cap with 27 million euro of revenue against expected revenue of 50-75 million euro and 13 million euro of current market cap).
Conclusion
As you can see, the real-world value of the business is a combination of quantitative and qualitative research where you are highly aware of what you own. This thought process allows you to react to changes much faster (for example, when the asymmetry narrows). In our practical example, the price range is from around 0.7 euro per share in the worst case to around 5.7 euro in the best case (by applying a 12x P/E on a 6% profit margin and 75 million euro of revenue, with double-digit growth rates compared to a competitor with a current 40x P/E and slower growth rates). The odds for the lower-bound price are unlikely due to tailwinds, execution, growth, expectations, and an already low valuation, whereas the odds for a price between 2 euro and 5 euro are much higher. Thanks to your careful judgment and common sense, you became the house, not the gambler. You don't expect to make over 5 euro per share from this investment against a 0.9€ execution price; you just know that with a high probability you will win between 100% and 500% but lose no more than 20%. When the asymmetry narrows due to a new higher bid or business meltdown, you are now able to switch to other opportunities possessing better payoff and asymmetry, while likely exiting with a profit from the previous holdings and beating the benchmarks.
Above is an illustration from an ongoing investment case. You can see why I'm so confident in my bet without a need to speculate or to react to price movements with emotions. These are the situations where you can make meaningful bets. Your individual investment returns are reflections of the time spent to understand what you own. This is what, for example, Buffett and Munger talk about in various forms and perspectives. That is how you keep rolling over your investments for years to build substantial wealth. The more rocks you turn over, the more asymmetry you find to adjust your holdings, over and over again. Thank you for reading, and I hope you find this useful in your investment journey.